
A recent poll on whether enterprise risk frameworks should employ a risk taxonomy or not seems to have turned out an encouraging result. Over 93% of risk practitioners voting gave a thumbs up for risk categorisation and only a handful of souls repelled the concept.
In this posting we look at four steps to bring a risk taxonomy into operation and a Dendrogram Cluster Report is demonstrated to show how risk can be prioritized within a taxonomy.
In this posting we look at four steps to bring a risk taxonomy into operation and a Dendrogram Cluster Report is demonstrated to show how risk can be prioritized within a taxonomy.
The poll result below is quite a unanimous result and a clear sign that risk taxonomies are a commonly accepted framework practice among risk practitioners today.

Curiously, the majority of those opposing the formation of a risk taxonomy seem to originate from the hardcore ISO 31000 purest camp. This is understandable because ISO 31000 doesn't formalize or explicitly describe how the creation of a risk taxonomy can be achieved so the concept is likely to be novel to some of the purists.
ISO 31000 Perspective?
ISO 31000 doesn't specifically recommend that a taxonomy is created, yet it describes the "types and nature" of risks that organisations may face. By painting risk in this light ISO 31000 is inferring that a risk taxonomy should be present.
ISO 31000 also states that a risk framework needs to be customised to suit the entity it is being applied to. On one hand we can assume that creating a risk taxonomy isn't exactly a forbidden practice under the ISO 31000 guidelines but on the other, ISO 31000 doesn't describe how to go about creating such a categorisation system.
G31000 Risk Taxonomy Poll | Martin Davies
Taxonomy at a business layer
We have discussed the importance of risk categorisation before on this blog [ LINK ] and if a risk taxonomy is appropriately established, a network of cause and threat categories will be generated as an outcome. Such a category list is shown below but this taxonomy needs to be contextually relevant for the business it is being applied to and, different firms operating in alternate industry sectors are likely to have different structural requirements to consider.
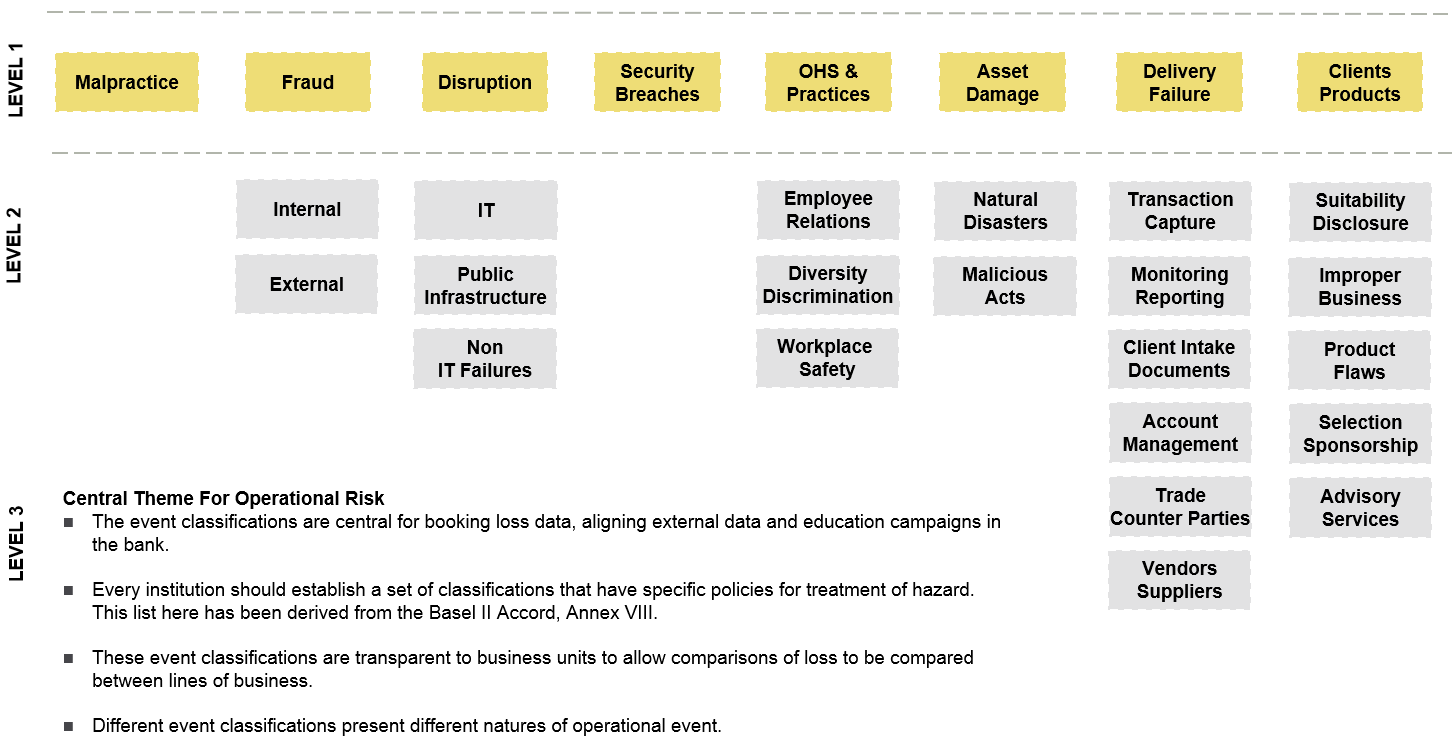
Op Risk Categorisation Business Layer | Causal Capital [Click image to enlarge]
The diagram above is the definition layer for operational risk categories under the Basel II Banking Accord and it is important for creating scope when an risk analysts investigate incident data that has been collected from their business units.
Taxonomy at a model layer
The taxonomy structure can also be taken from a risk management plan and inserted into a statistical modelling environment such as R-Project. In the diagram below, we have done such a thing and it isn't as much work as you might first imagine.

Operational Risk Categorisation Model Layer | Causal Capital [Click image to enlarge]
With the taxonomy now embedded into the business management layer of the risk framework and the IT system layer enabled, it becomes much easier to partition loss event data in a homogeneous manner.
This partitioning will improve the transparency of risk reports and allows for benchmarking of risk performance to be estimated across the entire business. From a management perspective, risk analysts will be able to develop a standard response to specific threats that each business unit faces.
This partitioning will improve the transparency of risk reports and allows for benchmarking of risk performance to be estimated across the entire business. From a management perspective, risk analysts will be able to develop a standard response to specific threats that each business unit faces.

Process of establishing a taxonomy | Causal Capital [Click image to enlarge]
One concern some risk analysts have raised as a reason for pushing back on a risk taxonomy is; "Such a formal system of tagging threats, causes and outcomes, may result in risks that 'mutate' being lost."
Risk(s) can mutate, which I define as one of the following in the context of a risk taxonomy:
[1] A new risk emerges or a new condition comes into existence.
[2] An existing risk becomes non-stationary and multicollinear with time. This risk may be variant but this variance grows or decays through time and the growth acceleration factor itself might be changing. This is potentially a very dangerous and unstable risk.
[3] An existing risk starts correlating with other threats or factors to generate new outcomes. In effect, it leads to different and new problems and literally leaps across the taxonomy structure that was original established.
[4] A new risk is identified which doesn't fit into the taxonomy.
A sound taxonomy policy structure should be able to treat these taxonomy issues and a special category such as "default / unassigned case" category is reserved for such risk events.
Many people believe that a risk taxonomy hinders the assignment of "risks that mutate" but it actually does the opposite. The taxonomy helps the identification of 'mutating risk' because highlights non conformance within an existing taxonomy, anomalies become visible rather than hidden.

Cluster Dendrogram from Loss Data | Causal Capital [Click image to enlarge]
The cluster analysis or dendrogram that we have performed on our loss incident data above, is a simple way of assigning data points to categories that may have multiple dimensions.
A hierarchical cluster in the dendrogram separates each group into small sub groups and changes in tree nodes clearly show which risks are mutating.
The cluster calculation we have applied in our example also scales the loss data that drove the report. It uses Euclidean distancing to identify which risks are mutating, which risks are concentrating and which risks need the greatest attention.
No comments:
Post a Comment