
Recently I had a discussion on modelling risk with a fantastic and successful business person who said to me : "I have read about Monte Carlo, you even make mention to it on your blog but it doesn't make great sense to me. The maths in Monte Carlo is even worse because it seems to confuse the concept by taking it into an academic place that most people aren't from.
Is it possible to explain Monte Carlo by using a tool we all understand such as Microsoft Excel?"
So be it, this blog posting is an Excel example of Monte Carlo and Loss Data. Due to the size of the post, it will be separated into two, possibly three updates.
Is it possible to explain Monte Carlo by using a tool we all understand such as Microsoft Excel?"
So be it, this blog posting is an Excel example of Monte Carlo and Loss Data. Due to the size of the post, it will be separated into two, possibly three updates.
The business problem
Let's take a typical risk problem in the world of operational risk. Actually, let's try and make (Frequency x Magnitude) work by using Monte Carlo and I have written about the use of Monte Carlo for such pleasures before [Link Here].
For the sake of example, we are going to pretend that we have a business unit which makes very expensive gold plated dongles (apparently a dongle is a computer accessory) for mass consumption. Now, during our hypothetical manufacturing process some dongles break because of random errors, sometimes they are dropped or go missing, employees have a tendency of sitting on them and accidentally we are told and, so on hence forth. The list of errors causing dongle loss is quite astounding it seems and the manager of the department has been told to model the expected financial loss from dongle mania each month. The purpose of this estimated loss measure is so that the firm can establish a reserve budget to cover for the costs of dongle casualties.
In our example, the manager has identified the following variables as being potential candidates for modelling the expected loss from his department and the associated recovery from dongle breakage. These variables are:
F The number of dongles which are damaged each month
M The potential financial loss from the breakage of a missing dongle
R The recovery rate for dongles
A The amount recovered
But before we can leap into building a Monte Carlo solution, we need to take time to observe the behaviour of some of these variables. The operational risk exercise we choose to understand the business variables better is often referred to as a Loss Data activity.
Loss Data Exercise
In our Loss Data exercise we capture only a handful of variables: Number of units produced each month, the number of loss events per month, as well as the total loss value from all risk events each month.
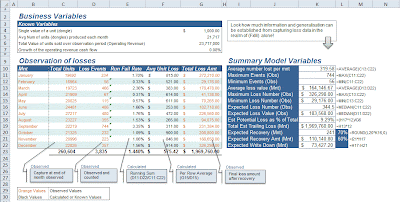
The first thing that is strikingly amazing about this quick process is that a huge amount of statistical generalisation can be established from only a handful of variables. We are able to discover our expected exposure value straight up and we can derive the maximum expected worst case of losses as well.
In our Loss Data exercise we capture only a handful of variables: Number of units produced each month, the number of loss events per month, as well as the total loss value from all risk events each month.
Loss Data Exercise in Excel [Click to enlarge]
The first thing that is strikingly amazing about this quick process is that a huge amount of statistical generalisation can be established from only a handful of variables. We are able to discover our expected exposure value straight up and we can derive the maximum expected worst case of losses as well.
Loss Data exercises are perhaps one of the most important activities in operational risk and they supply a huge amount of insight into the nature of risk events that a business may face. In many cases, the Loss Data analysis is based around the most basic form of static models and it is still very valuable summary information.
If you were a bank regulated under Basel II, the process of capturing and reporting losses is actually mandated. However, what I find completely bewildering is that there are so many institutions outside banking that don't give the collection and rectification of Loss Data much credence. In my opinion, a typical conversation one might have with an average risk manager on measuring risk seems to be too heavily focused on control self-assessment much of the time. Don't misunderstand me, control self-assessments or CSA as it is often referenced has its place and it is a very useful tool to identify which controls are effective but CSA is not the real deal. Control Self-Assessments are a pre-event measure in most cases, while Loss Data on the hand is actualised outcome.
If you were a bank regulated under Basel II, the process of capturing and reporting losses is actually mandated. However, what I find completely bewildering is that there are so many institutions outside banking that don't give the collection and rectification of Loss Data much credence. In my opinion, a typical conversation one might have with an average risk manager on measuring risk seems to be too heavily focused on control self-assessment much of the time. Don't misunderstand me, control self-assessments or CSA as it is often referenced has its place and it is a very useful tool to identify which controls are effective but CSA is not the real deal. Control Self-Assessments are a pre-event measure in most cases, while Loss Data on the hand is actualised outcome.
What is learned?
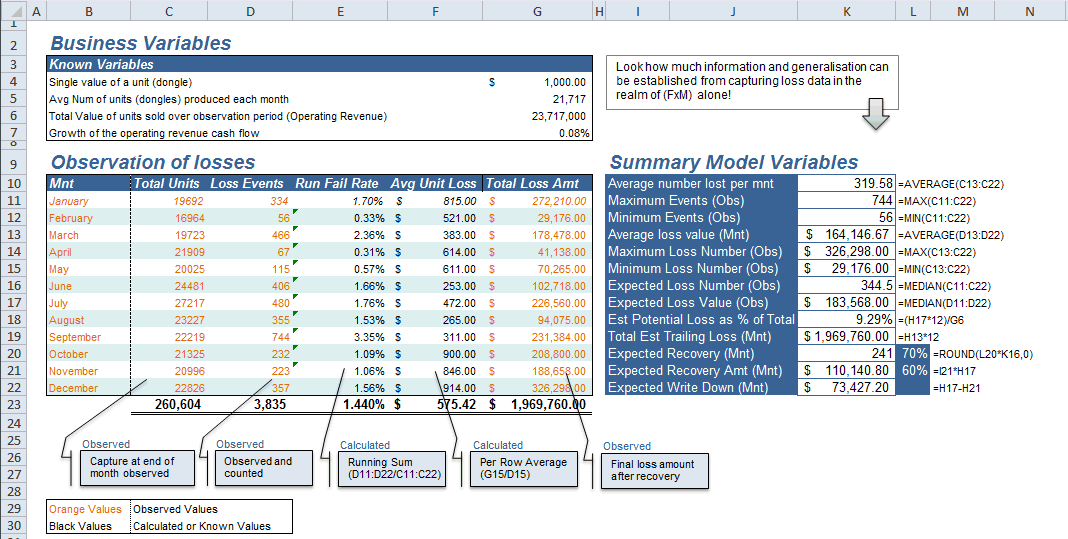
Before we can leap into Monte Carlo or extend the model further, we need to understand the relationship between our selected variables better. For example; one might want to know that if the business was to grow its output, would the loss values increase, would the two variables of production and loss grow at a similar rate?This growth factor is important because if we don't understand the correlation in line with the rate of growth, we might find our loss reserve is likely to always fall short.

Analysing the relationships in Excel [Click to enlarge]
The result from our OLS calculation was quite unexpected might I add and the two independent variables (units produced and loss events) had a very low correlation factor or R-Squared number in this instance.
Incredible, it appears that the observed number of units produced doesn't seem to correlate to the number of risk events occurring. How strange and it would be intuitive thinking that if we produce more, we stand to lose more. In this example however, that doesn't seem to be true and the data is actually telling us a different story.
Is this type of result normal? --- Yes!
Yes, in effect you can think outside the box by being in a box. In the world of operational risk the number of people who refuse to categorise potential loss events is so scarily high that I ponder in amazement at the state some of their risk systems must be in. I feel in many cases risk managers try to leap back into their world of tick-box assessment when presented with canyon wide gaps of measurement experience.
In our world of dongle manufacturing most of our losses might be originating from thefts rather than units being damaged during production. Remember, we are producing gold plated dongles. So then, losses we have are driven by the trustworthiness of staff and the state of security controls around logistics rather than the process of failure during dongle assembly.
There are other tests we might want to do as well to paint a clearer picture of our loss experience. We might find that the frequency of losses increase in certain months, loss events might occur in clusters, recovery rates might be time dependent and different categories of loss may have different recovery rates. There are a whole range of straightforward tests we can carry out around loss data and certainly some of these tests should be engaged before entering into the Monte Carlo bonanza.
So that is it for part 1 and in part 2 we will look at the unique steps for the Monte Carlo process.
So that is it for part 1 and in part 2 we will look at the unique steps for the Monte Carlo process.

Original brain storming around the problem
The notes from the original Monte Carlo discussion have been inserted into this blog to collect and tag the original quick thinking to the blog. These notes are really that, a momentary assembly of ideas.
No comments:
Post a Comment